Leave Your Message

How to Choose the Best Freight Transport in 2026?

Choosing the right Freight Transport in 2026 requires more than comparing quoted prices. A low rate can hide port delays, limited tracking, extra handling, or weak delivery reliability. The World Bank’s Logistics Performance Index 2023 highlights customs, infrastructure, shipment quality, and timeliness as major logistics performance factors. These measures turn a vague promise into practical questions.

The scale is substantial. UNCTAD’s Review of Maritime Transport 2024 states that maritime shipping carries over 80% of global merchandise trade. Road, rail, air, and sea services each solve different problems. A refrigerated shipment may need temperature alerts, while construction materials may need capacity and flexible delivery windows. Professor Alan McKinnon, a leading freight-transport researcher, puts it plainly: “There is no single solution to the freight transport problem.”

The best option therefore depends on cargo value, urgency, distance, risk, emissions targets, and destination infrastructure. A 2026 comparison should examine total landed cost, not only the transport invoice. It should also test carrier performance, insurance arrangements, digital visibility, fuel exposure, and contingency plans. The International Transport Forum’s Transport Outlook 2024 reinforces the need for resilient and lower-emission transport systems, especially as freight demand continues evolving.

No model is perfect. Forecasts can fail. A cheaper route may become expensive after one missed connection. A greener option may lack charging infrastructure outside major corridors. This guide weighs those trade-offs using industry evidence, operational experience, and measurable service standards. The goal is not to choose the fastest carrier every time. It is to choose the most dependable fit for each shipment.
How to Choose the Best Freight Transport in 2026?

Define Shipment Needs Using IATA’s 1% Volume and 35% Value Air-Cargo Benchmark

Choosing freight transport in 2026 starts with the shipment, not the vehicle. IATA’s air-cargo analysis states that air freight carries less than 1% of global trade by volume, yet more than 35% by value. This contrast matters. A compact shipment containing high-value electronics, medical equipment, or urgent replacement parts may justify air transport. A low-value, heavy shipment usually cannot.

Measure four details before requesting rates: weight, cubic volume, cargo value, and delivery tolerance. For example, a 200-kilogram package filling two pallets may be cheaper by ocean or rail. A 20-kilogram component stopping a production line is different. It may need air service, careful handling, and live tracking. The International Transport Forum’s freight studies also emphasize reliability, not speed alone. A fast route with repeated delays is not truly fast.

The benchmark is useful, but imperfect. It describes global trade, not every shipment. That distinction is easy to miss. The World Bank’s Logistics Performance Index 2023 also highlights customs efficiency, infrastructure, tracking, and delivery reliability. Compare those factors with your route and destination.

Ask whether the promised transit time includes handling, clearance, weekends, and local delivery. Then calculate total landed cost, including inventory risk and possible damage. Sometimes the cheapest mode becomes expensive after one missed delivery. Mistakes happen. Recheck the assumptions.
Compare Sea, Rail, Road, and Air Against UNCTAD’s 80% Maritime Trade Share

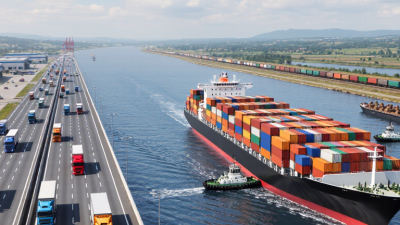
In 2026, freight selection starts with scale, urgency, and geography. UNCTAD’s Review of Maritime Transport reports that shipping carries over 80% of global merchandise trade by volume. Sea transport suits heavy, non-urgent cargo, such as machinery, furniture, and full containers. A 40-foot container usually costs far less by sea than by air. However, port congestion, weather, and customs delays can disrupt carefully planned schedules. The cheapest route is not always the most reliable one.

Rail offers a middle path between cost and speed on established continental corridors. The International Transport Forum expects freight demand to keep rising sharply through 2050, increasing pressure on road networks and terminals. Road transport remains essential for collection and final delivery. Eurostat reported that road accounted for roughly three-quarters of EU inland freight activity in 2023. Air is different. The International Air Transport Association states that air cargo represents about 35% of global trade value, despite moving less than 1% by volume. It fits urgent electronics, medical equipment, and high-value components, but fuel and capacity costs can change quickly.

Use rail when distance is long and schedules are stable. Choose road when flexibility matters. Select air only when delay costs exceed freight costs. That calculation is often underestimated. A practical 2026 plan should compare door-to-door time, transfer points, insurance, carbon exposure, and backup capacity, not just the quoted transport rate. Even experienced shippers sometimes overtrust published transit times.

How to Choose the Best Freight Transport in 2026?

Sea transport carries more than 80% of global merchandise trade by volume, according to UNCTAD. This chart compares indicative freight-emission intensity across the main transport modes.

Lower values indicate lower estimated greenhouse-gas emissions per tonne-kilometre. Sea and rail are generally preferable for emissions-sensitive, high-volume freight; road offers greater inland flexibility, while air is best reserved for urgent, high-value shipments because of its much higher emissions intensity.

Data: indicative representative freight-emission factors in grams of CO₂e per tonne-kilometre, based on publicly reported government and international transport benchmarks. Maritime trade share: UNCTAD, Review of Maritime Transport.

Calculate Cost and Transit Time with Distance, Weight, Fuel, and Handling Data

How to Choose the Best Freight Transport in 2026?

A reliable freight choice starts with four measurable inputs: distance, weight, fuel use, and handling. Distance determines the base movement cost and expected transit time. Weight affects vehicle capacity, loading effort, and fuel consumption. Handling includes loading, unloading, storage, screening, and transfer fees. These details often change the final quote.

Use a simple estimate: total cost equals base rate plus distance cost, fuel surcharge, weight charge, and handling fees. For example, a 1,000-kilogram shipment traveling 800 kilometers may need 320 liters of fuel. At 1.60 per liter, fuel costs 512 before labor and road charges. Add two handling events at 75 each. The working estimate becomes 587 plus the carrier’s distance rate and other confirmed charges. Check every assumption.

Transit time needs the same discipline. Divide distance by realistic average speed, then add loading time, transfer delays, rest periods, and possible weather disruption. An 800-kilometer route may require 16 driving hours, but two handling stops can add four more. A rushed estimate looks attractive. It may fail in practice. My early calculations often ignored queue time at busy terminals. That mistake made low-cost options appear faster than they were. Ask for measured route history, not only a promised delivery window. Record actual arrival times after each shipment, and adjust future calculations using those results.

How to Choose the Best Freight Transport in 2026? - Calculate Cost and Transit Time with Distance, Weight, Fuel, and Handling Data

Illustrative comparison for a 1,000 kg non-hazardous shipment traveling 1,000 km, with 5.0 m³ volume and four standard pallets.

Transport Mode Typical Service Distance Shipment Weight Volume Fuel / Energy Cost Component Handling & Accessorial Cost Estimated Freight Cost Estimated Transit Time Best Use Case
Road Freight Less-than-truckload, terminal-to-terminal 1,000 km 1,000 kg 5.0 m³ / 4 pallets Approx. US$0.16 per tonne-km
US$160
US$190
Pickup, terminal transfer, delivery, and documentation
US$850–1,150 1–3 days Flexible door-to-door delivery and regional distribution
Rail Freight Container or wagon service with local drayage 1,000 km rail line-haul 1,000 kg 5.0 m³ / 4 pallets Approx. US$0.07 per tonne-km
US$70
US$420
Drayage, terminal handling, loading, and unloading
US$650–950 3–6 days Lower-cost movement when rail terminals are accessible
Intermodal Rail + Road Rail line-haul with road pickup and final delivery 800 km rail + 200 km road 1,000 kg 5.0 m³ / 4 pallets Approx. US$0.09 per tonne-km blended
US$90
US$360
Two transfers, terminal handling, and local drayage
US$700–1,000 3–5 days Balanced cost, emissions, and coverage for long inland routes
Air Freight Airport-to-airport with road collection and delivery 1,000 km flight distance 1,000 kg chargeable weight 5.0 m³ / 4 pallets Approx. US$2.80 per chargeable kg
US$2,800
US$650
Security screening, airport handling, fuel surcharge, and local delivery
US$3,450–4,500 1–2 days Urgent, high-value, or time-critical shipments
Short-Sea / Coastal Shipping Port-to-port service with inland road connections 800 km sea + 200 km road 1,000 kg 5.0 m³ / 4 pallets Approx. US$0.04 per tonne-km sea leg
US$32 equivalent
US$620
Port handling, documentation, drayage, and terminal transfer
US$900–1,300 5–10 days Large-volume, non-urgent freight moving between coastal ports

Cost calculation method: Estimated freight cost = line-haul energy or fuel component + handling and accessorial charges + normal carrier operating margin and network costs.

Chargeable weight: Air freight is commonly priced using the greater of actual weight and volumetric weight. Using a standard divisor of 6,000, 5.0 m³ equals approximately 833 kg volumetric weight; therefore, the 1,000 kg actual weight is used in this example.

Fuel assumption: Road and rail energy components use indicative 2026 planning values derived from typical commercial fuel consumption and average fuel-price conditions. Actual fuel surcharges vary by country, lane, vehicle type, and contract.

Handling assumption: The shipment is palletized, stackable, non-hazardous, and ready for loading during normal business hours. Residential delivery, lift-gate service, customs clearance, storage, insurance, taxes, duties, tolls, and special packaging are excluded.

Planning guidance: Road is generally the most flexible option, rail and intermodal can reduce cost over long inland distances, air minimizes transit time, and short-sea shipping is most suitable when port access and a longer delivery window are available.

Measure Carbon Impact Using GLEC Framework Emission Factors for Each Mode

How to Choose the Best Freight Transport in 2026?

Measure Carbon Impact Using GLEC Framework Emission Factors for Each Mode

Choosing freight transport in 2026 requires more than comparing price and delivery speed. Carbon impact should be measured for every available mode. The GLEC Framework provides emission factors for road, rail, sea, air, and inland waterway transport. These factors help convert freight activity into comparable greenhouse gas emissions.

Start with accurate shipment data. Record cargo weight, distance, loading location, delivery location, and transport mode. A 12-ton shipment moving 800 kilometers by road should be measured in tonne-kilometers. Then apply the relevant factor for that mode. Keep fuel type, vehicle size, empty running, and temperature control visible. Small details can change the result.

Use real operational records whenever possible. Generic factors are useful, but they represent averages. My own calculations have not always been clean. Missing distance data once produced a misleadingly low estimate. That error showed why every assumption needs documentation. Review the result with transport managers and compare it against fuel records or carrier data. Air freight may deliver faster, while rail or sea freight often lowers emissions. The right choice depends on urgency, cargo sensitivity, route reliability, and measured carbon intensity. Recheck factors when routes, vehicles, or shipment volumes change. Numbers age quickly.

Select Multimodal Options and Validate Reliability, Risk, and 2026 Regulations

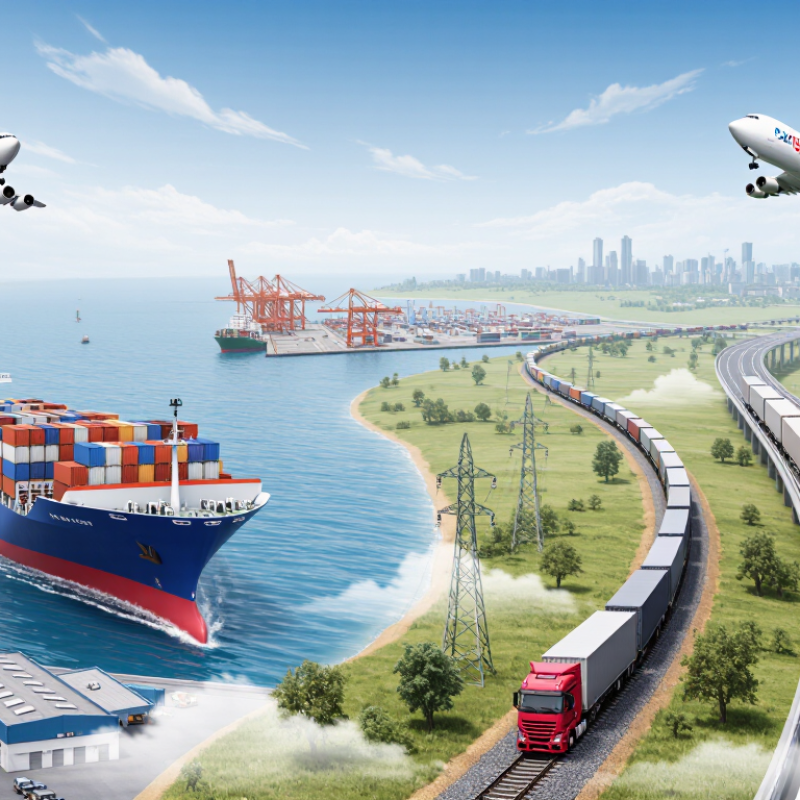
Choosing freight transport in 2026 requires more than comparing quoted rates. A multimodal plan can combine road, rail, sea, and air around cargo value, urgency, and handling risk. Sea transport still carries over 80% of global merchandise trade by volume, according to UNCTAD’s Review of Maritime Transport 2024. Yet one missed rail connection can erase the savings.

Reliability should be measured with shipment records, not confident promises. Check on-time performance, dwell times, damage claims, insurance limits, and backup routes. The World Bank’s Logistics Performance Index 2023 shows major differences in customs efficiency, infrastructure, and delivery predictability between economies. Ask for lane-specific evidence. A polished network map proves little.

Risk checks need physical detail. Review temperature logs, seal controls, weather exposure, port congestion, and handover responsibility. I have found that the weakest transfer point often deserves the most attention. That is not always the cheapest leg. Regulatory validation is equally practical. For applicable voyages, check EU Emissions Trading System obligations and FuelEU Maritime requirements. Confirm customs data, safety filings, and security documentation before booking. Requirements can change during a contract year. Recheck them.

No score is perfect. A carrier with strong historical results may still fail during a strike, storm, or cyber incident. Use scenario testing, written escalation contacts, and quarterly reviews. Keep evidence. That habit makes decisions more defensible in 2026.